

County Agriculture Profiles
go.ncsu.edu/readext?720507
en Español / em Português
El inglés es el idioma de control de esta página. En la medida en que haya algún conflicto entre la traducción al inglés y la traducción, el inglés prevalece.
Al hacer clic en el enlace de traducción se activa un servicio de traducción gratuito para convertir la página al español. Al igual que con cualquier traducción por Internet, la conversión no es sensible al contexto y puede que no traduzca el texto en su significado original. NC State Extension no garantiza la exactitud del texto traducido. Por favor, tenga en cuenta que algunas aplicaciones y/o servicios pueden no funcionar como se espera cuando se traducen.
Português
Inglês é o idioma de controle desta página. Na medida que haja algum conflito entre o texto original em Inglês e a tradução, o Inglês prevalece.
Ao clicar no link de tradução, um serviço gratuito de tradução será ativado para converter a página para o Português. Como em qualquer tradução pela internet, a conversão não é sensivel ao contexto e pode não ocorrer a tradução para o significado orginal. O serviço de Extensão da Carolina do Norte (NC State Extension) não garante a exatidão do texto traduzido. Por favor, observe que algumas funções ou serviços podem não funcionar como esperado após a tradução.
English
English is the controlling language of this page. To the extent there is any conflict between the English text and the translation, English controls.
Clicking on the translation link activates a free translation service to convert the page to Spanish. As with any Internet translation, the conversion is not context-sensitive and may not translate the text to its original meaning. NC State Extension does not guarantee the accuracy of the translated text. Please note that some applications and/or services may not function as expected when translated.
Collapse ▲This project was a collaboration between the NC State Extension Local Food Program, NC FarmLink, and the Center for Environmental Farming Systems (CEFS).
On This Page
| Supporting Resources |
| State and County Profiles |
| Council of Government Regional Profiles |
North Carolina’s agricultural industry, including food, fiber and forestry, contributes $111.1 billion to the state’s economy, accounts for more than 16 percent of the state’s income, and employs 16 percent of the workforce.1 Statewide market value of agriculture products as reported by USDA 2022 Agriculture Census is $18,692,574,000.
North Carolina is one of the most diversified agriculture states in the nation. The state’s 42,817 farmers grow over 80 different commodities, utilizing 8.1 million of the state’s 31 million acres to furnish consumers a dependable and affordable supply of food and fiber. The state ranks eighth nationally in Total Market Value of Agricultural Products Sold.2 Net income per farm in the state is over $147,411.3
This Local Food and Farms infographic is designed for economic developers, planners, local food advocates, and community members to understand the impact of their county and region to the overall NC agricultural economic impact. The economic indicators provided here can help local governments as they design ways to support agricultural businesses as key components of vibrant and resilient, local, and rural economies. Each region in North Carolina presents a unique set of opportunities for sustainable economic growth and entrepreneurship. To help start the conversation, we created discussion points for Farms and Food Profiles.
Consider one example: When school systems purchase food from local farmers, students benefit from access to healthy fresh produce, farmers benefit from sales into local schools, and the community benefits because these local sales are spent at other local businesses. This type of local business opportunity keeps farms in production, maintaining North Carolina’s agricultural asset base both in terms of land and farming know-how. And it keeps dollars spent on food circulating among other local businesses.
1 Agriculture and Agribusiness: North Carolina’s Number One Industry
2USDA North Carolina State Profile
3 USDA State Summary Highlights
Supporting Resources
- Data Sources & Definitions for Local Profiles: A list of data items, what they mean, and where to locate them within the Ag Census data.
- Discussion Points for Local Profiles: Ideas for where and how to share the information from these local profiles. Be creative!
- Bringing it Home: Using USDA Ag Census Data at the County Level (June 2020 Recorded Webinar): This webinar reviews how to access and interpret Agriculture Census Data.
- Economic Contribution of North Carolina Agriculture and Agribusiness: See page 13 for dollar and jobs multipliers for selected farm sectors.
- Forestry Economic Impact: Extension Forestry compiles industry economic impact data in county-based fact sheets.

Local Farms and Food Profiles
2022 North Carolina State Agriculture Profile (2017 profile)
Council of Government Regional Profiles
There are 16 regional Council of Governments (CoGs) across North Carolina. The map below shows their distribution. You can find more information about each Cog through the North Carolina Association of Regional Councils of Governments.
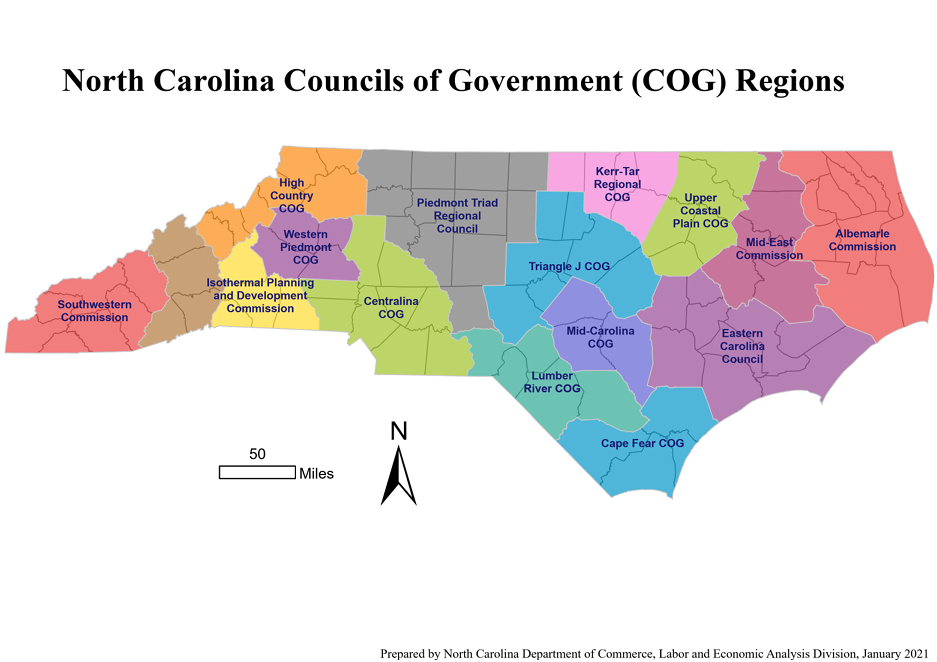
Map of Councils of Government across North Carolina. (NC Department of Commerce, 2021).
| Council of Government | Year |
| Albemarle | 2022 |
| Cape Fear | 2022 |
| Central Pines (formally Triangle J) | 2022 |
| Centralina | 2022 |
| Eastern Carolina | 2022 |
| Foothills | 2022 |
| High Country | 2022 |
| Kerr-Tar | 2022 |
| Land-Of-Sky | 2022 |
| Lumber River | 2022 |
| Mid-Carolina | 2022 |
| Mid-East | 2022 |
| Piedmont Triad | 2022 |
| Southwestern | 2022 |
| Upper Coastal Plain | 2022 |
| Western Piedmont | 2022 |